Folium is a powerful Python library that is used to create several types of Leaflet maps. Here are some examples:


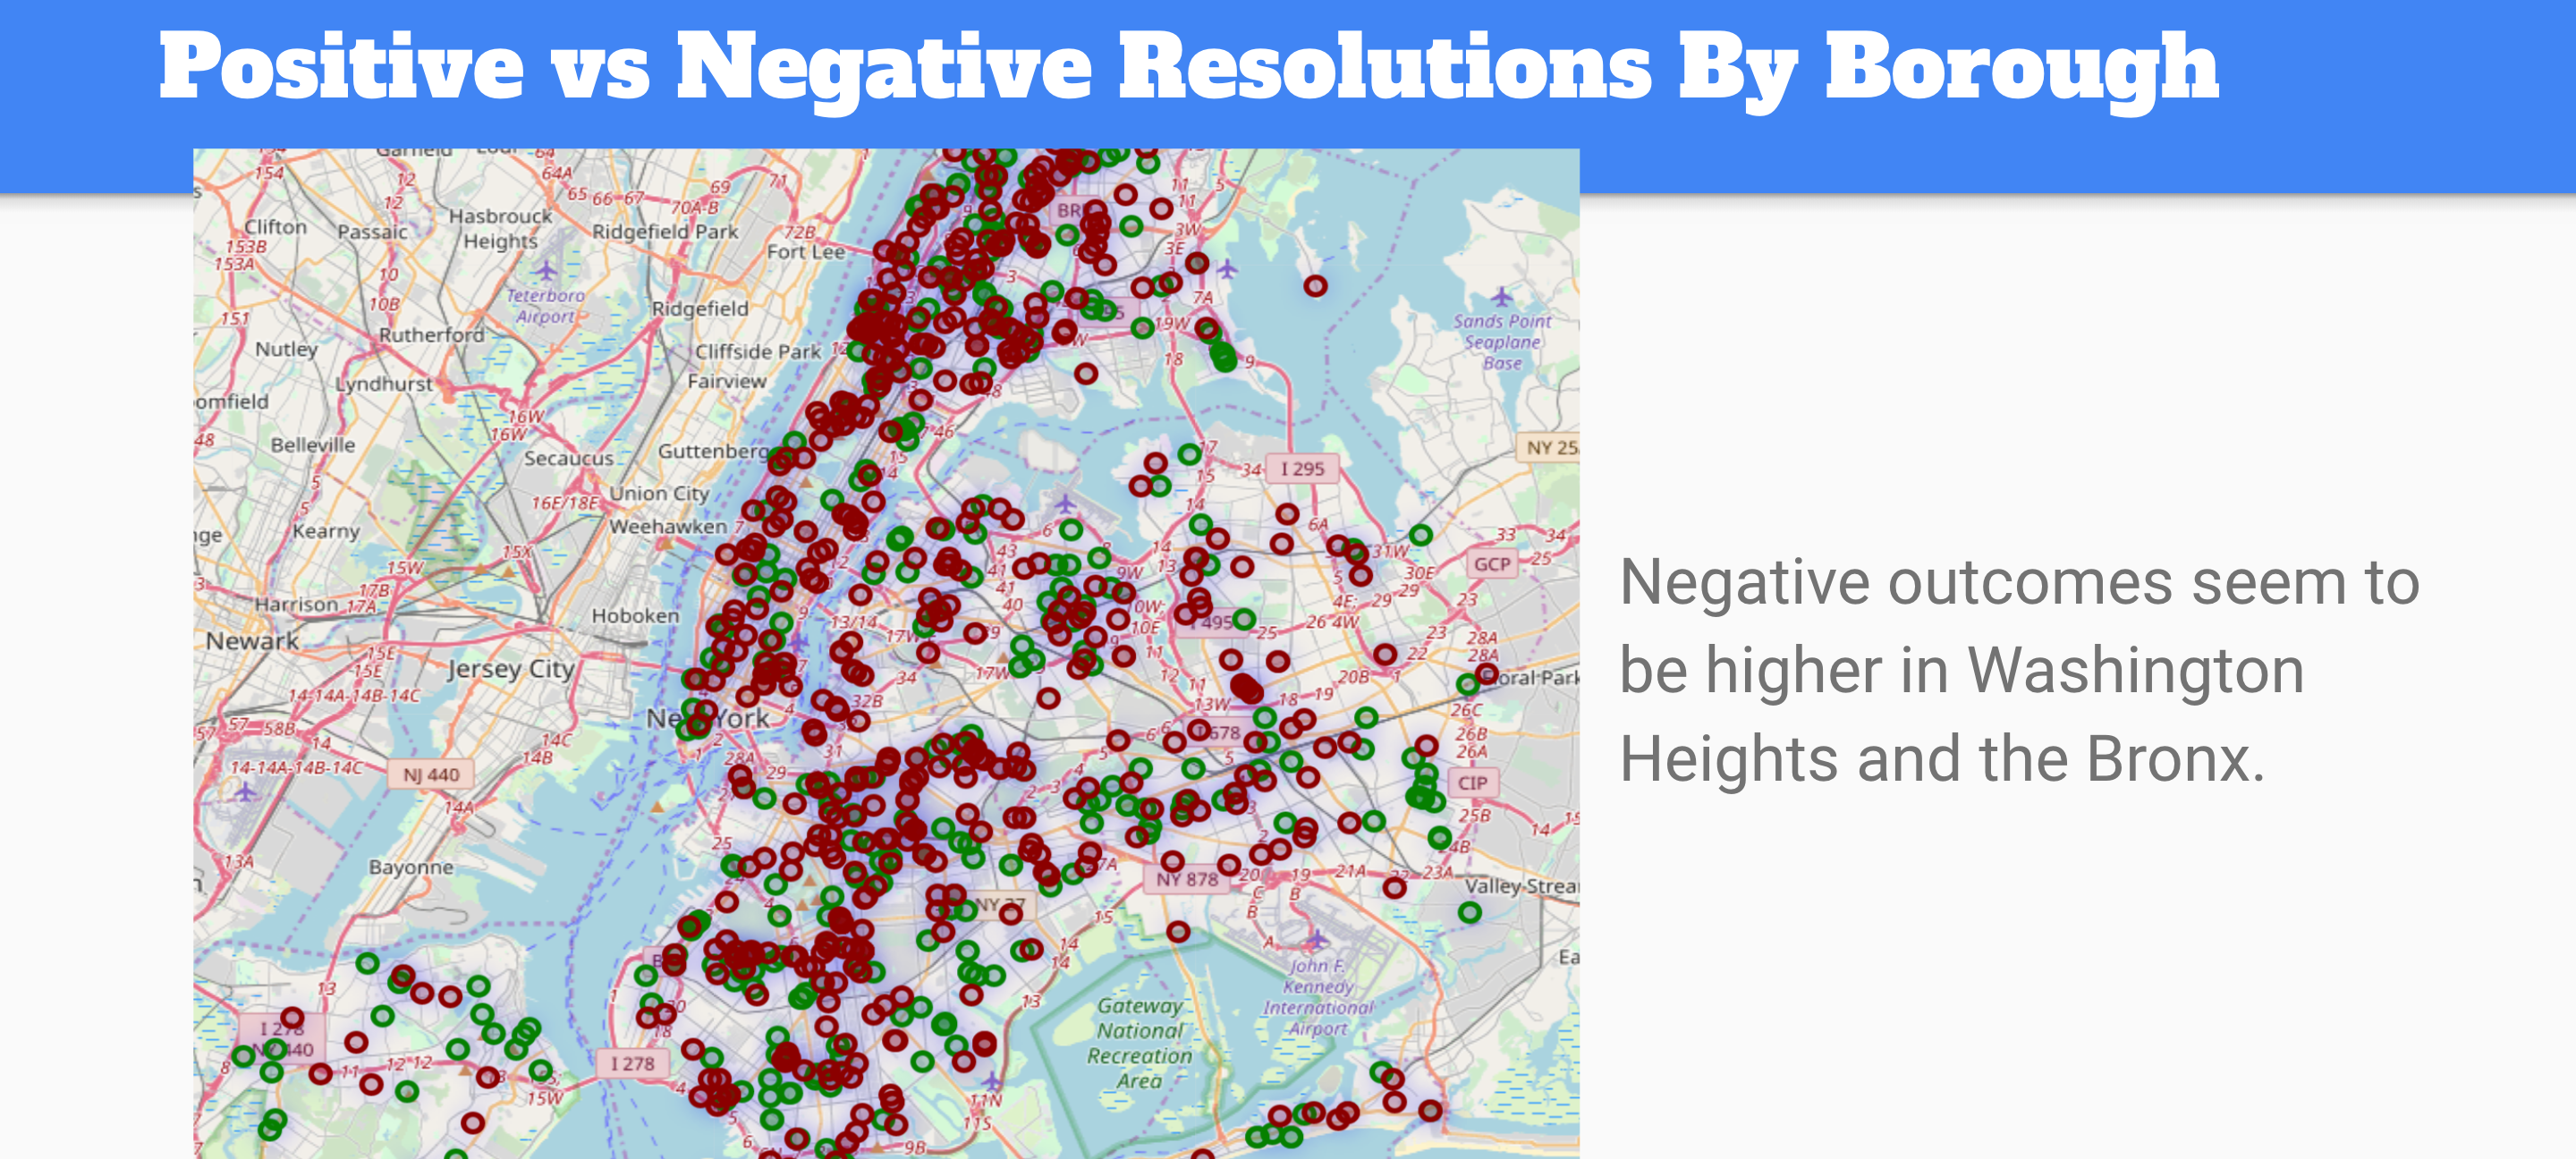
Using Folium, I created some map visualizations showing the Positive and Negative Resolutions for different features in the 311 Service Requests dataset.
Let’s go over the code to show how this is done.
import folium

fol = aug[['agency', 'borough', 'complaint_type', 'latitude', 'longitude', 'resolution_outcome']]
fol.dropna(inplace=True)
so we take our aug dataframe and narrow down the features. In order to properly map out the data, we also have to drop any NaN values.
m = folium.Map([40.7218, -74.0060], zoom_start=11)
m

We create our base map by inputting the latitude and longitude, in this case [40.7218, -74.0060] is the coordinates of New York City.
for index, row in fol.iterrows():
    folium.CircleMarker([row['latitude'], row['longitude']],
                        radius=15,
                        popup=row['complaint_type'],
                        fill_color="#3db7e4", # divvy color
                       ).add_to(m)
Our for loop here goes through each row of our fol database. A folium CircleMarker is created at the latitude and longitude provided in each row. When we hover over the marker it lists what the complaint_type was at that location. Finally, the last step is to add the marker to the map named m with .add_to(m)
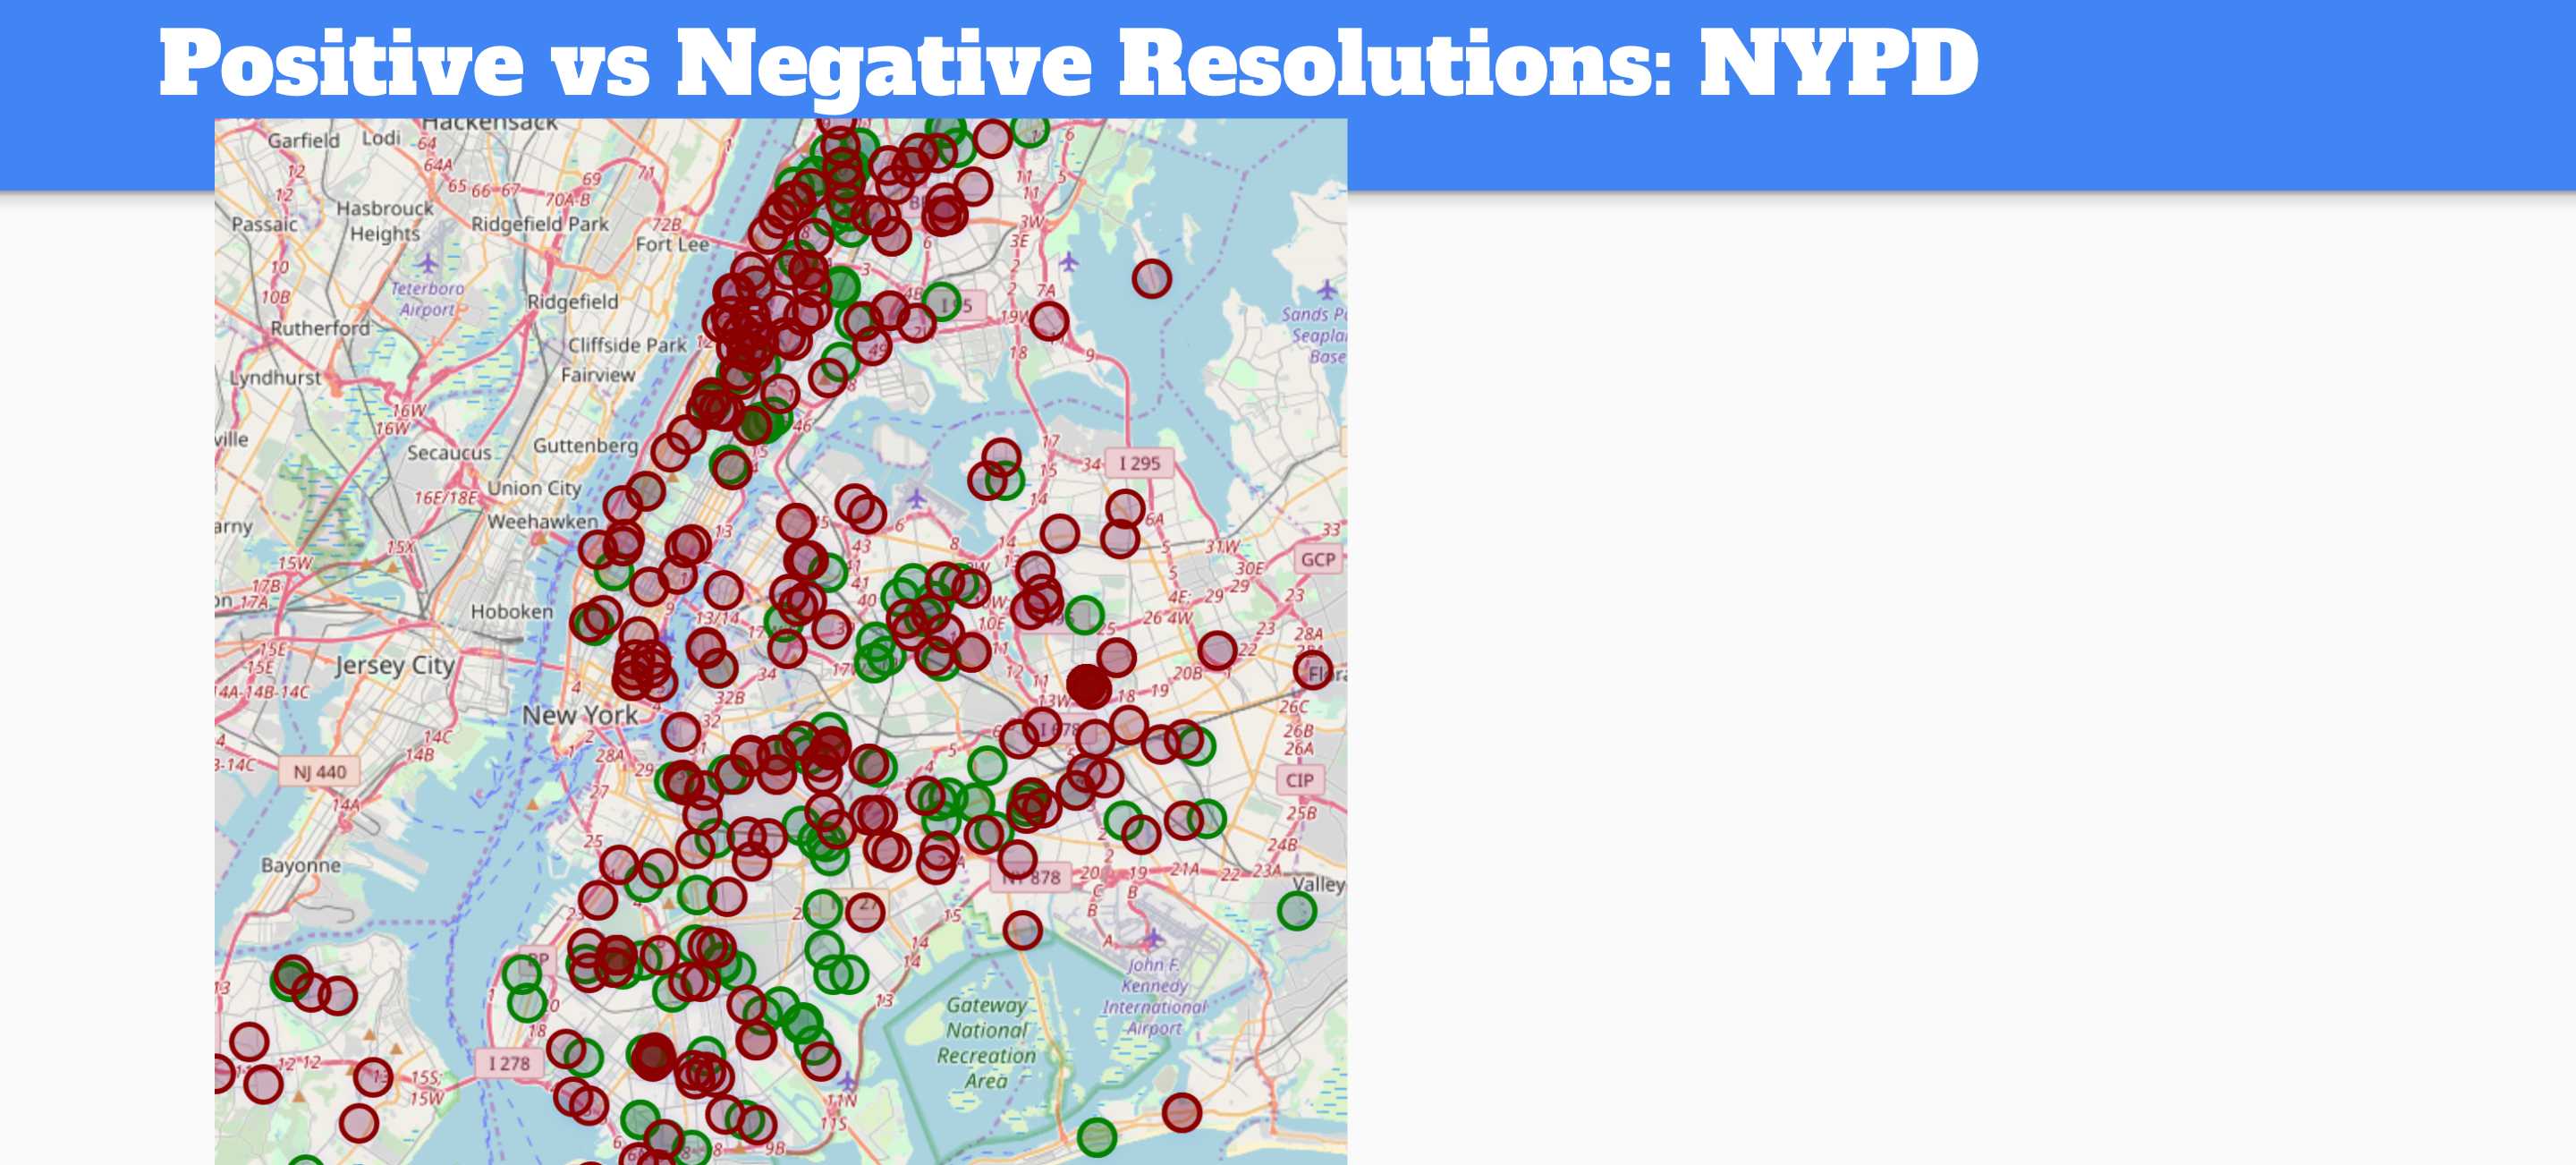
In one of the earlier pictures, I showed the positive and negative resolutions of service requests that were handled by the NYPD agency. To do this, I used .loc to create a database where the agency==’NYPD’ and then repeated the steps above.
police = fol.loc[fol['agency']=='NYPD']

for index, row in police.iterrows():
    folium.CircleMarker([row['latitude'], row['longitude']],
                        radius=15,
                        popup=row['complaint_type'],
                        fill_color="#3db7e4", # divvy color
                       ).add_to(m)
It is important to note that we are adding this information to the map named m. If we ran our code above, both the initial markers and the police markers would be found on our map. To reset the map we would have to set the variable m again by m = folium.Map([40.7218, -74.0060], zoom_start=11)
