When using predictive classification models in machine learning, we need a metric to determine if the predictions the model is making are “good.” Here is a confusion matrix I created from one of the machine learning models:

This can also be read and interpreted as:

The top left number of 116 is a true negative which means the actual value being predicted is negative and the machine learning model predicted that the value is negative.
The bottom left number of 23 is a false negative which means the machine learning model predicted an item was negative but the actual item was positive.
The top right number is a false positive and the bottom right number is a true positive. From this information we can calculate Precision and Recall.


Precision is the measure of the correctly predicted positive cases from all the predicted positive cases. Precision is useful when the costs of False Positives is high. In our example above our precision is 0.693


Recall is the measure of the correctly identified positive cases from all the actual positive cases. Recall is useful when the costs of False Negatives is high. In our example above our Recall is 0.77
F1 Score
F1 Score is used when you seek a balance between Precision and Recall. A false negative and a false positive will have tangible and intangible costs to a company, therefore a metric that seeks a balance between the two is usually a better metric. F1 Score is also used when there is an uneven class distribution.
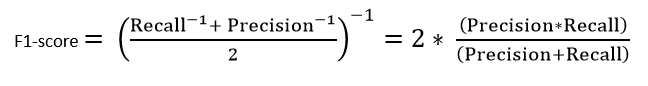
An F1 score reaches its best value at 1 (perfect precision and recall) and worst at 0. Our F1 Score in our example is 0.729
from sklearn.metrics import f1_score
In Python, we can calculate the F1 score by importing the sklearn.metrics library. We run f1_score on the y_test data and the model’s predictions on the X_test set of data. But we’ll cover more on that next week.

One thought on “Using F1 As A Metric For Classification”